


In her third-year course on statistics, a Faculty of Health psychology professor and her teaching assistant help students overcome their fear about statistics by empowering them to understand the power and potential of data.
By Elaine Smith
Monique Herbert is determined to help psychology students to overcome their fear of statistics and embrace quantitative reasoning.
“A lot of my students’ fear about statistics is because they tie it to the idea that it’s math and math is difficult,” said Herbert, an associate professor of psychology in the teaching stream. “When you help them understand the purpose of statistics and connect their use to real-world problems or psychological data, they begin to lose their fear and understand.”
In her third-year course, Intermediate Statistics I, students enter the class already knowing some statistical basics, so she takes them further into the realm of data, teaching them to work with the types of data they might use while doing their own research or read about in research publications written by others. “As students progress through the course, they comment on how it has helped them to read articles more carefully and gain an appreciation for being able to critically appraise the work of others,” Herbert said. “It’s empowering for them.”
Throughout the course, students have many opportunities (mini activities, a group project, and a data analysis and reporting assignment) to explore a problem using data and must learn the statistical software R – an innovative programming language, which helps to lay out the process for analyzing those data. These tasks foster critical thinking, Herbert says, because if they do not understand the process, they will not achieve the desired output. Students are provided with customized R tutorials prepared by Course Teaching Assistant (TA) Mark Adkins, a psychology PhD student in the Quantitative Methods program, to help students use and apply R (see example).
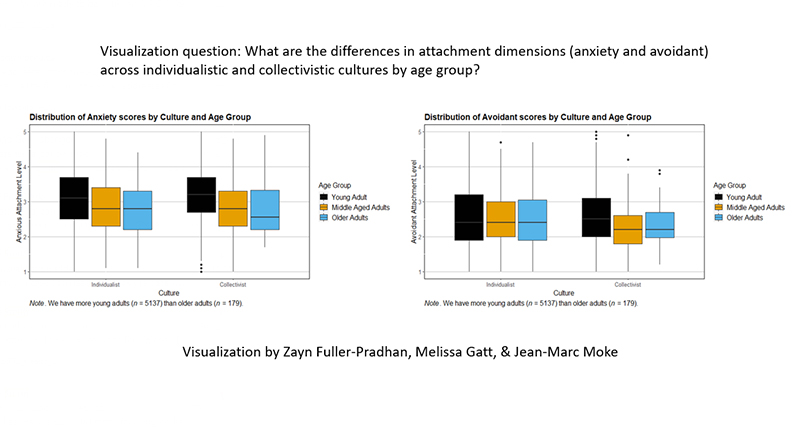
One of the course projects for which students can apply and display their R skills is an exercise in data visualization, which is done in groups of two or three.
“People may not always understand the results from data analysis when presented just as a listing of means and standard deviations, for example,” Herbert said. “In these cases, we need to present our statistical information with pictures to get the message across. We talk about audience quite a bit; if it takes the reader an inordinate amount of time to figure out the visual, it’s not working.”
The student teams can choose any data set they like for this project. Herbert and her TA are on hand to guide them as they proceed.
“We tell them to take the product to their family or friends to see if they understand it,” she said.
The other purpose of the data visualization project is to have students work in teams.
“There isn’t a lot of opportunity in statistics courses to work in groups and achieve a common goal,” Herbert said. “We have a lot of conversations about what makes a great team and how to play to your strengths. Group work is helpful, because peers can assist you, although each student in the group must be able to replicate the code themselves.”
They are required to keep a reflective learning journal about their class experiences, documenting their observations about working alone and being part of a team – all, as Herbert notes – “healthy reflection.”
Given that many of these students go on to do a thesis in psychology or another field, Herbert is confident that they will leave with tools that allow them to communicate easily with other researchers.
“If students leave this course, walk into a lab and are given a data set to work with, they will know how to proceed,” Herbert said. “If not, these skills come in handy in critically appraising and translating information. They are skills that benefit the students academically and for life.”